Mondelēz 2023 Snacking Made Right Report: Carbon Footprint
We’ve been applying the principles of the Greenhouse Gas (GHG) Protocol to our business for more than a decade. Drawing on the input of functions throughout the business – including Manufacturing and Logistics, Finance and Procurement – and working with external partners and our suppliers toward a framework for more consistent carbon reporting across our Scope 1, 2 and 3 emissions.
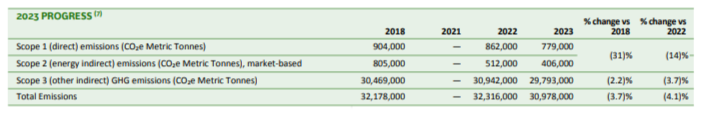
2023 PROGRESS
Approximately -3.7% GHG emissions reduction across our value chain (vs. 2018) (1).
DEFINING OUR SCOPES 1, 2 AND 3 EMISSIONS (1)
For Scope 1, we identify and report on the combustion of fuels taking place in our own facilities and mobile operations, as well as any fugitive emissions from our sites.
Measuring Scope 2 emissions involves assessing indirect emissions associated with the electricity, heat and steam we buy for our own facilities.
And for Scope 3, we measure the indirect emissions generated within our value chain, such as the emissions generated from materials and services we buy, emissions generated from activities associated with fuel and energy, and emissions generated from finished goods storage and transportation, as well as business travel and investments.
COMPLETENESS AND CONSISTENCY (1)
To help ensure that our carbon footprint reporting is more consistent, we expose our data to external verification and align our internal processes with the GHG Protocol standards. As part of this, we published our formalized carbon accounting manual during 2023. And we continued to increase the internal processes we use to promote consistency of approach, in the form of a growing range of Standard Operating Procedures (SOPs).
We continue to keep our carbon inventory up to date, now including the recently acquired Clif Bar & Company and excluding our more recent divestiture in gum. Further, we have updated our emissions factors to incorporate the most recent World Food Life Cycle Assessment Database (WFLDB 3.9) and Ecoinvent 3.9, which led to some updates vs prior year's data. Overall, our emissions continue to reduce over the years as we continue transitioning our materials to a number of new customized emissions factors, allowing us to reflect the strategic efforts following our three focus areas to reduce our emissions. Find out more in Reducing Carbon: Three Key Drivers.
Our end to end emissions are aligned with SBTi guidelines where we focus on our most impactful and actionable GHG emissions across the value chain (approximately 90% of our end to end CO2e emissions in base year 2018).
WHERE OUR CARBON FOOTPRINT COMES FROM
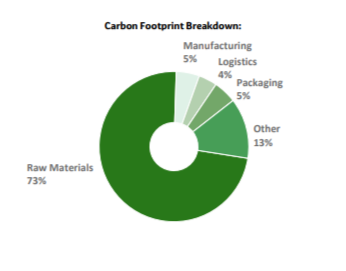
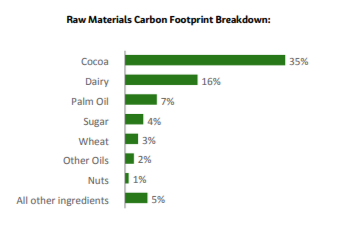
Similar to other food manufacturers, we see about 73% of our footprint driven by raw materials. Cocoa and dairy are the two largest contributors in our footprint driven by our portfolio followed by: palm oil, sugar, wheat, other oils, nuts and all other ingredients.
The remaining approximately 27% are broken out across internal and external manufacturing, our packaging used to keep our products safe and protected during transportation and handling, logistics operations linked to storage and transportation of finished goods, and various other categories. Other includes emissions related to investments, external manufacturing raw materials, services, upstream fuel and energy-related activities, business travel and small categories.
Our end-to-end footprint has reduced by approximately (3.7)% compared to our 2018 baseline or approximately (4.1)% compared to emissions in the prior year. Our Scope 1 and 2 emissions continue to decrease, reflecting our progress in renewable electricity and energy efficiency. We reduced our Scope 1 and 2 (market-based) emissions by approximately (31)% compared to our 2018 baseline and approximately (14)% compared to emissions in the prior year.
Our Scope 3 emissions have decreased by approximately (2.2)% compared to our 2018 baseline, or approximately (3.7)% compared to emissions in the prior year as we continue to capture the positive effects of our various roadmaps, with the biggest impact coming from Cocoa.
Our carbon reduction strategy is based on our focus areas, which each have a distinct roadmap.
REDUCING OUR CARBON FOOTPRINT IN OUR SUPPLY CHAIN
MANUFACTURING
We’re focusing on increasing both our energy efficiency and our use of renewable energy (with a focus on electricity), so that we can go further in reducing our carbon emissions and our costs. In 2023, about 48% of the electricity we used in our manufacturing sites was renewable, compared to around 40% in 2022 (2).
We are also continuing to make adjustments to how we operate. We are leveraging improved processing designs for enhanced efficiency. For example, we are replacing some natural gas baking ovens with low-carbon fuels or electricity. Find out more in Energy.
LOGISTICS OPERATIONS
We are working to reduce the emissions across our logistics operations. Efforts include investing in new and energy-efficient mobility solutions, as well as switching to renewable energy sources in our warehouses. We’re also optimizing routes, reducing travel distances and improving the ways in which we use trucks and containers. Find out more in Logistics.
PACKAGING
We continue to strive to make our packaging “Light and Right.” This means working towards reducing the virgin plastic material used in our packaging, while not compromising the quality and integrity of our products. We have deployed more sustainability design requirements across our global business. These requirements are aligned with industry guidelines – such as the CGF’s Golden Design Rules – to promote consistency with contemporary good practice. By designing our packaging to be recyclable, evolving to more sustainable materials and increasing our use of recycled content, we are working towards improving carbon intensity across our portfolio. Find out more in Sustainable Packaging.
RAW MATERIALS - COCOA
Our signature program, Cocoa Life, was created 11 years ago to help tackle the complex, interconnected challenges in the cocoa value chain. In 2023, our Cocoa Life program reached around 243,000 cocoa farmers (3), and approximately 85% of the cocoa volume for our chocolate brands was sourced through the program (4).
Two key elements drive our cocoa emissions reduction: agroforestry and farming practices. Conserving the land and forests is important for future generations. Forests help stabilize the climate. They regulate ecosystems, protect biodiversity, drive more sustainable growth – and play an integral part in the carbon cycle. We support farming communities with the right on- and off-farm tree planting activities and apply farm mapping technologies and agroforestry techniques to monitor progress.
Building on our work from 2022, we’re continuing to expand our list defining customized emission factors that will help us to reduce our carbon emissions intensity. In doing so, we’re using data to translate our interventions in deforestation prevention and agroforestry as well as farming practices into custom emission factors. In our major sourcing countries, this approach is resulting in lower emissions per tonne of product than we would obtain with generic emission factors. Find out more in Protecting & Restoring Forests.
RAW MATERIALS - DAIRY
Dairy is an area in which we have limited scale within the industry, but an important focus area in our footprint. To maximize our efforts, we have taken a two-pronged approach to help reduce carbon intensity in dairy: We work directly with farmers supplying our core brands Cadbury Dairy Milk and Milka, and we closely collaborate with strategic processors. Thanks to first tracking their CO2e emissions and then developing action plans to reduce them, some strategic suppliers have successfully completed their baselines and are delivering lower carbon intensity compared to their base year. Find out more in Dairy.
RAW MATERIALS - PALM OIL
We have much less global share in palm compared to cocoa. Our aim to seek no deforestation builds upon the company’s POAP which was first issued in 2014. It takes into account learnings and experience realized in the company’s efforts to collaborate with suppliers to source deforestation-free palm oil and applies those learnings across primary commodities. In the future this plan will also take into account current and impending regulation, as well as insights from external frameworks such as the SBTi 'and collaborative organizations such as Consumer Goods Forum Forest Positive Collation of Action (CGF FPC) and Palm Oil Collaboration Group (CGF POCG). Find out more in Palm Oil.
RAW MATERIALS - WHEAT
Another example of our efforts to help curb our supply chain footprint is our Harmony sustainable wheat program for our biscuits in Europe. We started the program 16 years ago with just a handful of farmers in France for our LU biscuit brand, and today we collaborate with more than 1,100 farmers, cooperatives and millers in seven countries in Europe. Our goal is to grow 100% of the wheat volume needed for our European biscuits production under our expanded Harmony Regenerative Charter by 2030. Harmony includes a results-based charter of 20 mandatory practices plus 17 best practices built in close collaboration with agronomic experts, NGOs and, of course, our wheat supply chain. We have started to translate those interventions into customized emission factors for our footprint. Find out more in Wheat.
PARTNERING AND INNOVATING TO HELP REDUCE OUR CARBON FOOTPRINT
SUPPLIER PARTNERSHIP PROGRAMS
In the last year, we have continued to build two major partnerships that are helping us better understand our broader Scope 3 emissions, while recognizing their level of alignment with our netzero plans.
First, we continue working with EcoVadis, a leading provider of business sustainability ratings, to better understand, monitor, and increase transparency of our supply chain sustainability maturity.
Second, we are a partner of Supplier Leadership on Climate Transition (Supplier LOCT), a consortium of world-leading businesses aiming to reduce supply chain emissions with an initial focus on our top suppliers to encourage them on their own journey to Net Zero. For those suppliers we identify as needing additional support, we will be offering access to the courses of the Supplier LOCT platform which aims to support them with creating their Scope 3 footprint, setting CO₂e reduction goals and reporting outcomes in line with the SBTi.
Investment Approach
We are always considering our investments looking in particular at how these affect our overall carbon footprint and as such reflect interactions including reduction of holdings in our analysis.
INNOVATION
During 2023, we’ve worked on many areas of innovation, which are aimed at helping us reduce our carbon emissions. Key examples include:
- Cocoa Enhancement: Working with the Alliance of Biodiversity International and CIAT (Centro Internacional de Agricultura Tropical) in a research collaboration to explore the feasibility and potential scale of using biochar as a carbon dioxide removal technology. Additionally, we are working with CIAT in a program called ‘Landscapes for Sustainable Cocoa Livelihoods (C4SL) developing and piloting a scalable community-based Payment for Ecosystem Services (PES) model for the conservation of forests and ecosystems services in Ghana.
- Wheat Pilot: Developing a three-year baseline alongside Michigan State University Extension to initiate a regenerative agriculture program in 2024 looking at the use of regenerative agriculture in wheat for Triscuit recipes.
- Dairy Research: Our R&D organization has collaborated with the International Farm Comparison Network (IFCN) Dairy Research Network and the Scienta Group to keep abreast of developments and help us reach our ambitions for 2030 and beyond.
- EcoDesign Development: R&D colleagues throughout our business now have access to a digital EcoDesign tool to help them build reduced environmental impact into product and process innovations, reformulations and portfolio shifts. We also use our eQoPack, a packaging assessment tool developed by Quantis to help us design more sustainable packaging.
- Reformulation Research: We are piloting a digital dashboard to help us capture the carbon-reduction potential available through reformulation. We’re also funding a project with The National Food Lab, Inc. to test the potential for taking dairy ingredients out of selected baked products with no negative impact on cost, taste or nutrition.
View the full 2023 Snacking Made Right Report
(1) Reported information following Science Based Targets initiative (SBTi) guidelines for near-term 2030 target excludes Capital Goods, Upstream Transportation and Distribution of Raw Materials, Business Travel Accommodation, Employee Commuting, Downstream Transportation at Customer, Consumer Use of Sold Products and End of Life Treatment. The long-term 2050 target excludes these same categories, except for Capital Goods, Upstream Transportation and Distribution of Raw Materials and Employee Commuting. The footprint includes all acquisitions and divestitures to date except for Chipita and Ricolino (subject to future data integration).
(2) Reported information excludes developed-market gum brands, which were divested as of October 1, 2023 (which differs from previous years). We have recalculated our base year 2018 (where applicable) and most recent years 2021, 2022 and 2023 for year-over-year comparison. Reported information based on latest estimate; independent, third-party verification in-progress. Any updates, if needed, will be included in the ESG Datasheet. Once completed, SGS verification can be found in our ESG Reporting & Disclosure Reporting Archive.
(3) Reported information for the period from January 1, 2023 to December 31, 2023 covers Brazil, Cameroon, Côte d’Ivoire, Dominican Republic, Ecuador, Ghana, Indonesia, India, and Nigeria unless otherwise stated (which differs from prior years). This data is provided by third parties. Reported information based on latest estimate; independent, third-party verification inprogress. Any updates, if needed, will be included in the ESG Datasheet.
(4) Goal and reported information for cocoa volume sourced is based on a mass balance approach, which means that the equivalent volume of cocoa needed for the products sold under our chocolate brands is sourced from the Cocoa Life program. Reported information for the period from January 1, 2023 to December 31, 2023 includes volumes from cocoa producing countries Brazil, Côte d’Ivoire, Dominican Republic, Ecuador, Ghana, Indonesia, India, and Nigeria unless otherwise stated (which differs from prior years). Excludes markets where Mondelēz International does not sell chocolate brands. Reported information based on latest estimate; independent, third-party verification in-progress. Any updates, if needed, will be included in the ESG Datasheet.