Towards Net Zero Buildings: Decarbonizing Buildings to the Benefits of Consumers and System Operators
Schneider Electric Sustainability Research Institute
Download the Schneider Electric™ Sustainability Research Institute report
Buildings are today responsible for 37% of emissions when considering both direct and indirect emissions (United Nations Environment Programme, 2022), and should be at the core of decarbonization policies worldwide. Still, we remain in a deadlock as highlighted in our previous research (Petit V. , 2022).
Decarbonizing buildings is possible
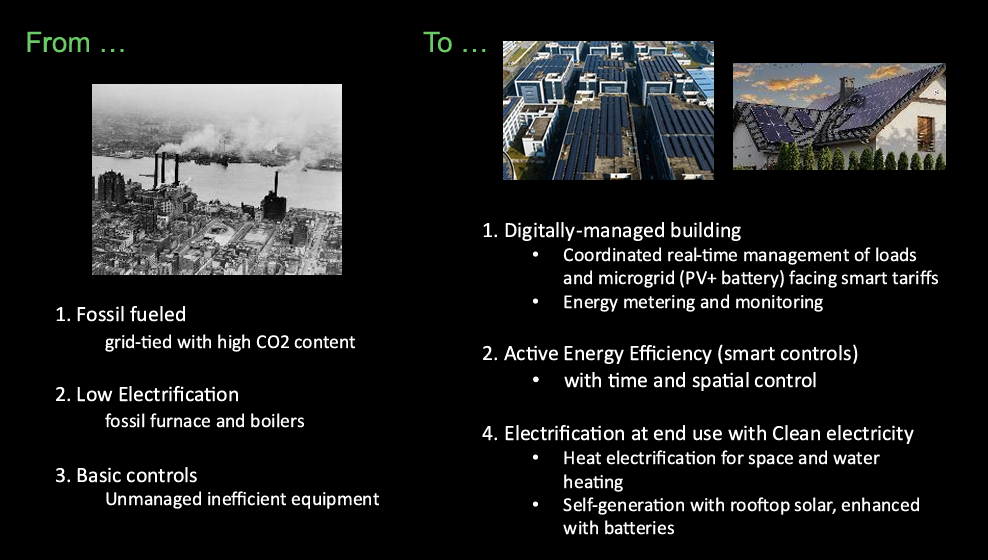
The Intergovernmental Panel on Climate Change clearly highlighted however that solutions are readily available (IPCC, 2022). Net-zero buildings are emerging as a solution to tackle climate change and reduce energy demand. These buildings, while not yet mainstream, strive to achieve a balance between the energy they produce on-site, often through renewable sources, and the energy they consume (Figure 1). This balance is achieved through maximizing energy efficiency measures and electrifying building systems like heating and cooling. Any remaining energy needs are then typically met through a low-carbon electricity grid.
A first of its kind analysis
The aim of this new report is to propose a close to real life analysis of the combined deployment of a heat pump, a building (or home) management system1, a rooftop PV and a stationary storage solution on a broad set of buildings, across different segments and regions.
Academic research has been traditionally focusing on either one or two technologies (and their varied impact across multiple geographies), or a larger combination of technologies within a given building asset. None has really combined both (Keiner, 2019), (Revathy, 2022), (Kun, 2022), (Kleinebrahm, 2023), (RMI, 2022), (Forero-Quintero, 2023).
This study is thus to our knowledge the first one encompassing such a wide combination of assets, building segments, geographies, taking into account real-life dynamic tariff structures, weather and CO2 data, as well as regional capital and operational expenditures of the deployed assets.
Optimization strategy options (peak management can apply with any of them) - Table #1.
| Energy Bill | CO2 emissions | Payback | |
| Bill reduction strategy (this study) | Optimal | Not optimal as not selecting electricity at time of lowest CO2 | Not optimal as selecting oversize PV/battery |
| CO2 reduction strategy | Not optimal as not selecting the lowest grid price | Optimal | Not optimal as selecting oversize PV/battery |
| Payback reduction strategy | Not optimal as selecting smaller PV/battery association | Not optimal as selecting smaller PV/battery association | Optimal |
We combine 3 original aspects:
- A fine segmentation: We consider specific building archetypes with their individual load, rooftop solar potential, and regional factors like weather patterns, local technology performance and costs, and dynamic electricity tariffs.
- A sequential optimization:
- Dispatch optimization simulation: We simulate building energy consumption on a 15min basis for a complete year. This incorporates a pre-defined microgrid management strategy using a model predictive control approach.
- Design optimization process: We select the best PV/battery combination among different tested options to achieve the optimization goal.
- A grid impact analysis: The simulation not only provides overall carbon emissions and energy consumption and costs, but also the complete annual load profile which helps assess the resulting impact of these measures on the power grid.
Focusing on a bill reduction strategy
From an optimization perspective, the strategic goal focused on here is to minimize the customer’s energy bill, as this is typically a key concern. Different strategies exist however such as reducing CO2 emissions, shortening payback period, managing peak load (maximum grid import), or a mix of all of them. Different optimization strategies would lead to different sizing for photovoltaic and battery systems, and different results.
Table #1 summarizes the key differences between different optimization approaches:
- Bill optimization: This strategy aims to directly use or store (using the battery) as much PV energy as possible while minimizing grid imports, purchasing electricity only when it is most affordable. This approach leads to larger PV and battery sizes, as investment cost isn’t prioritized, potentially resulting in a longer payback period.
- CO2 optimization: Like bill optimization, CO2 optimization prioritizes minimizing grid imports given its dynamic carbon intensity, regardless of cost.
- Payback optimization: This strategy focuses on achieving a specific payback target (either through maximizing internal rate of return or minimizing net present cost). It balances capital expenditure (capex) and operating expenditure (Opex) to find the optimal PV/battery combination2.
- Peak management: This strategy focuses on capping the maximum amount of power that is either drawn from the grid or supplied to it (when excess PV is available). While we speak of an optimization strategy, this peak management is applied as a constraint in our simulation in one of the 3 previous ones.
To access the rest of the findings and the full report, click here.
1. The focus of this study was on selecting energy conservation measures with reasonable paybacks, so discarding insulation in retrofits. Efficient insulation is taken de facto for new constructions through standards upgrades.
2. The size of the PV and especially the battery will generally be reduced


